Baking Graphics for Social Media
Project: While attending a Home Baking Association meeting, I learned that raw ingredients such as wheat flour need to be heated to a minimum temperature to be safe for eating. I thought putting the information into a graphic would help spread the message of food safety while being easy to read.
Timeline: September 2016
Results: The infographics was added to the website and social media. On Facebook, it performed better than 76% of our other infographics from the same month/year.
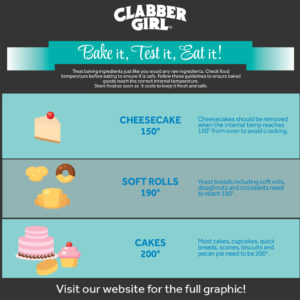
safe baking temps
Small Infographics for a Website
small graphics
Project: While writing copy for a new corporate website, I was thinking about what sort of images would work well on each page. I did some research and designed this set of infographics. I put all of my research into an Excel spreadsheet so I could track the statistics I had used and not used.
Timeline: May 2013
Results: The infographics were put on the website and helped compliment the website copy I had written.
Infographics for SEO
Project: As part of the company SEO efforts, I created infographics that could be distributed across a number of popular social media websites, posted as a blog and sent out to subscribers as part of an email marketing campaign. I came up with the initial concept for the infographics, designed them, wrote the copy and published them in a number of formats.
Timeline: July 2014 – present. Each infographic took about a week to complete.
Results: The infographics were shared across social media, providing valuable links back to the company website. It also helped to increase organic leads in July and August 2014. Organic traffic increased 20% compared to the same period last year and organic qualified leads increased by 26%.
(Click to Enlarge)
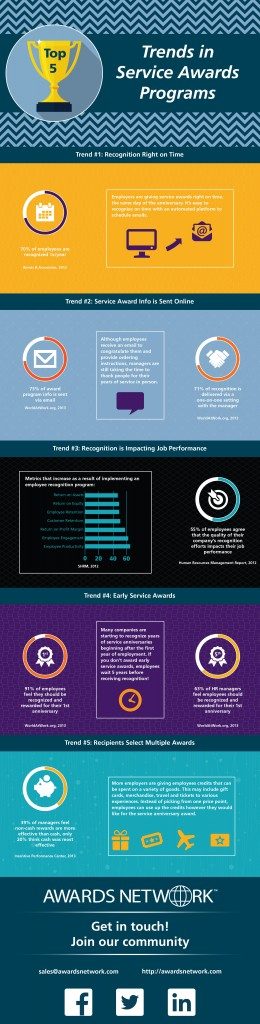
years of service award ideas

why employee recognition
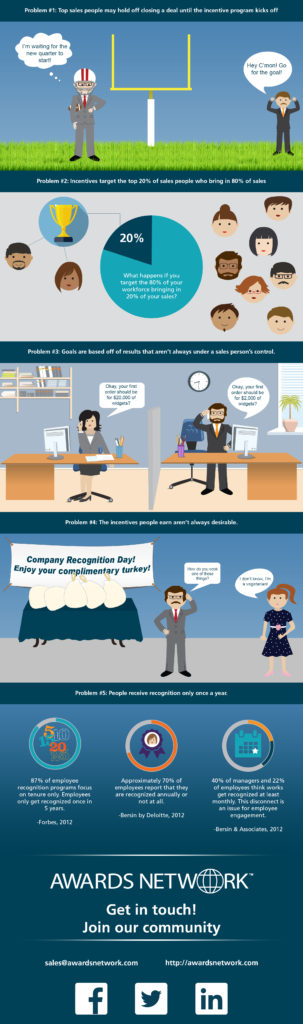
top 5 sales incentive mistakes to avoid